Service
How a leading facilities services provider uncovered carrier invoice leaks with Radaro Intelligence
A national facilities services provider used Radaro Intelligence to uncover carrier invoice discrepancies, cutting billing variance from a peak of 24% to about 1%.
The Results with Radaro
24
%
Peak invoice variance identified
24
%
Peak invoice variance identified
~
1
%
Invoice variance post-audit
~
1
%
Invoice variance post-audit
200
k
Drops completed annually
200
k
Drops completed annually
Company Overview
A national facilities services provider operating across Australia, with 160+ drivers completing ~200,000 drops annually, where transport performance is critical to daily operations.
As an existing Radaro customer, the organisation had already digitised key parts of its delivery execution. However, the team began to suspect variances between 3rd party carrier invoiced hours and actual hours worked. To resolve this, the organisation introduced Radaro Intelligence as a bolt-on advanced analytics capability to turn that execution data into visibility and what they found was eye opening.

Industry
Facilities Services
Use Cases
Advanced analytics, fully custom metrics, and BI dashboards aligned to specific business goals.
01.
The Challenge
Limited transparency into shift execution and billable hours.
Margin pressure amplified the impact of small, recurring inefficiencies.
Unexplained “time gaps” between jobs, shifts, and depot activity impacting transport costs.
Inconsistent break deductions and cost centre allocation.
Variable driver compliance impacting operational data quality and accuracy.
Manual, high-effort, reactive processes delaying issue detection and resolution.
Case Study One
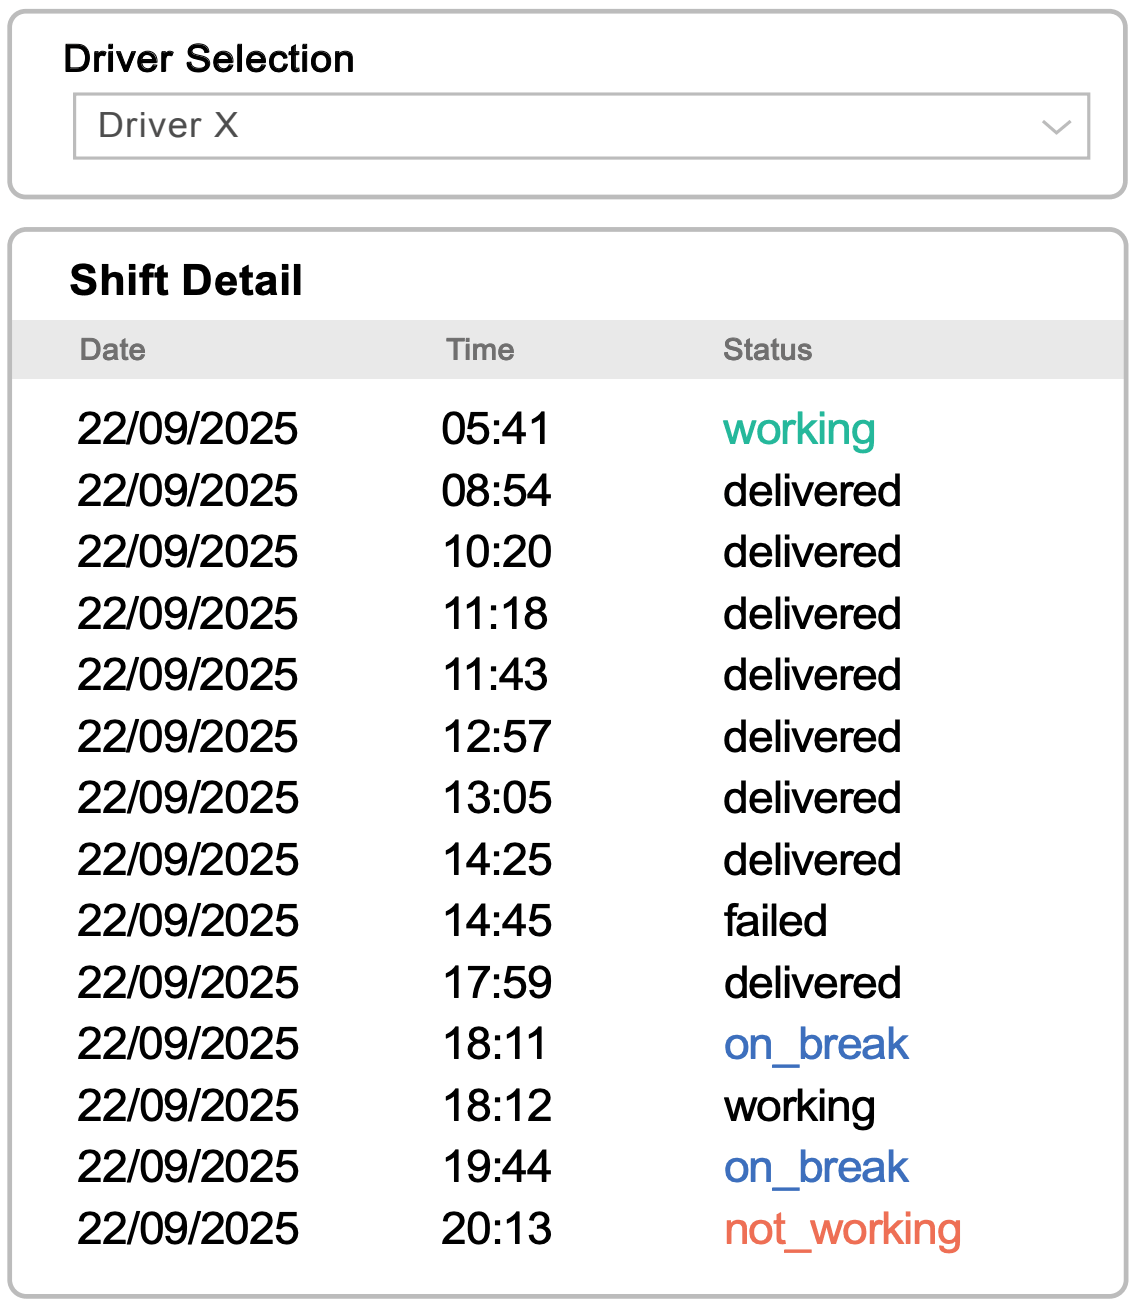
The image on the right is from the client’s previous Bi report, where there is no pickup, picked up, or in progress statuses visible. The screenshot is a real example sourced from their POD. In review, the client should have been shared 9.75 hours, leading to an identified variance of 4.25 hours.
Driver X on the 22nd of September, signed in as working at 05:41, and began being paid from 05:45.
Driver X completed 8 services over two trips for their customer. Driver X completed his last service at 17:59, which was a pickup only for one customer.
Driver then begun a break at 18:11, working a minute later, on break again at 19:44, and signed off as not working at 20:13, where they were paid until 20:15.
What this example shows is that Driver X clocked in to work 2 hours and 24 minutes before they begun loading the first customer in his vehicle, and signed out 2 hours and 14 minutes after completing his last delivery. The client was charged 14 hours for this shift.
In review, the client should have been shared 9.75 hours, leading to an identified variance of 4.25 hours.
Case Study One
The image on the right is from the client’s previous Bi report, where there is no pickup, picked up, or in progress statuses visible. The screenshot is a real example sourced from their POD. In review, the client should have been shared 9.75 hours, leading to an identified variance of 4.25 hours.
Driver X on the 22nd of September, signed in as working at 05:41, and began being paid from 05:45.
Driver X completed 8 services over two trips for their customer. Driver X completed his last service at 17:59, which was a pickup only for one customer.
Driver then begun a break at 18:11, working a minute later, on break again at 19:44, and signed off as not working at 20:13, where they were paid until 20:15.
What this example shows is that Driver X clocked in to work 2 hours and 24 minutes before they begun loading the first customer in his vehicle, and signed out 2 hours and 14 minutes after completing his last delivery. The client was charged 14 hours for this shift.
In review, the client should have been shared 9.75 hours, leading to an identified variance of 4.25 hours.
02.
The Solution
Introduced the advanced level of Radaro Intelligence to create a clear, auditable view of shift activity and carrier-billed hours.
Implemented a Shift Report BI page, aligned directly with pick-up workflows in the Radaro app, to create a consistent operational view of job activity, timings, and time gaps.
The organisation introduced structured governance, audits, and accountability processes to ensure issues were identified and addressed early.
The organisation conducted targeted driver training to increase app compliance and data accuracy.
Case Study Two
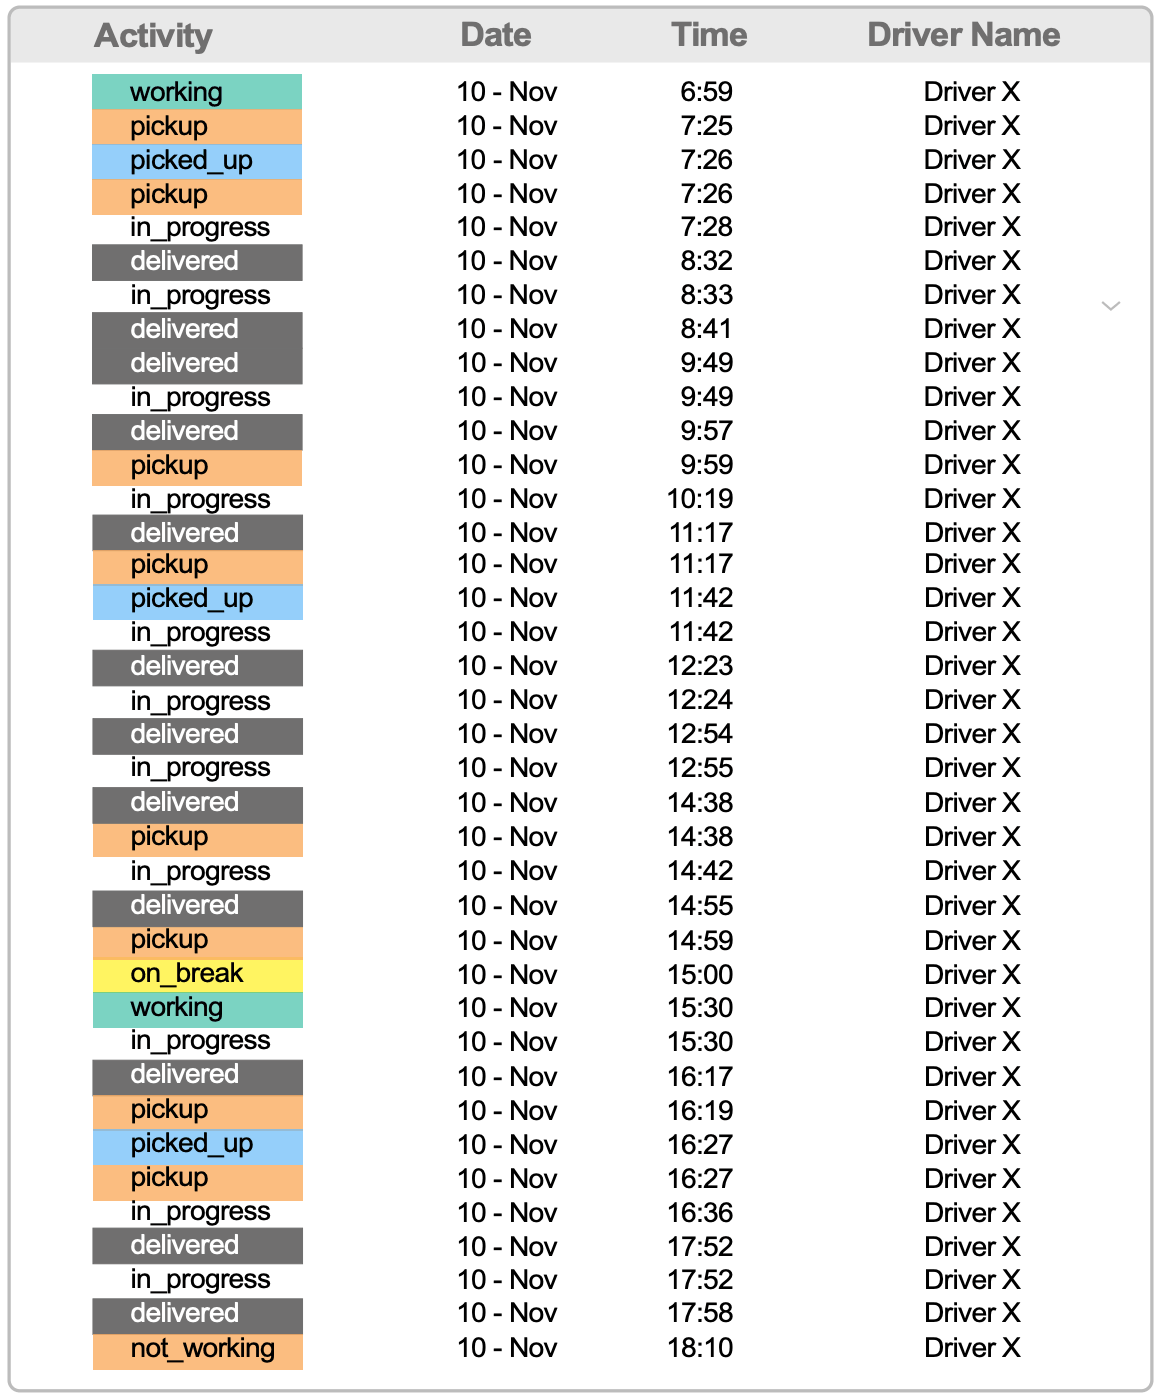
The example on the right is from the new Bi report and contains each activity the driver completes. Driver X, on the 10th of November, signed in as working at 06:59, and began being paid from 07:00. Driver X completed 9 services over 3 trips, where they began their break at 15:00 and returned to working at 15:30.
After returning, they completed another trip, servicing 3 customers by 17:58. Driver X signed out of working at 18:10 and was paid until 18:15.
Case Study Two
The example on the right is from the new Bi report and contains each activity the driver completes. Driver X, on the 10th of November, signed in as working at 06:59, and began being paid from 07:00. Driver X completed 9 services over 3 trips, where they began their break at 15:00 and returned to working at 15:30.
After returning, they completed another trip, servicing 3 customers by 17:58. Driver X signed out of working at 18:10 and was paid until 18:15.
03.
The Outcome
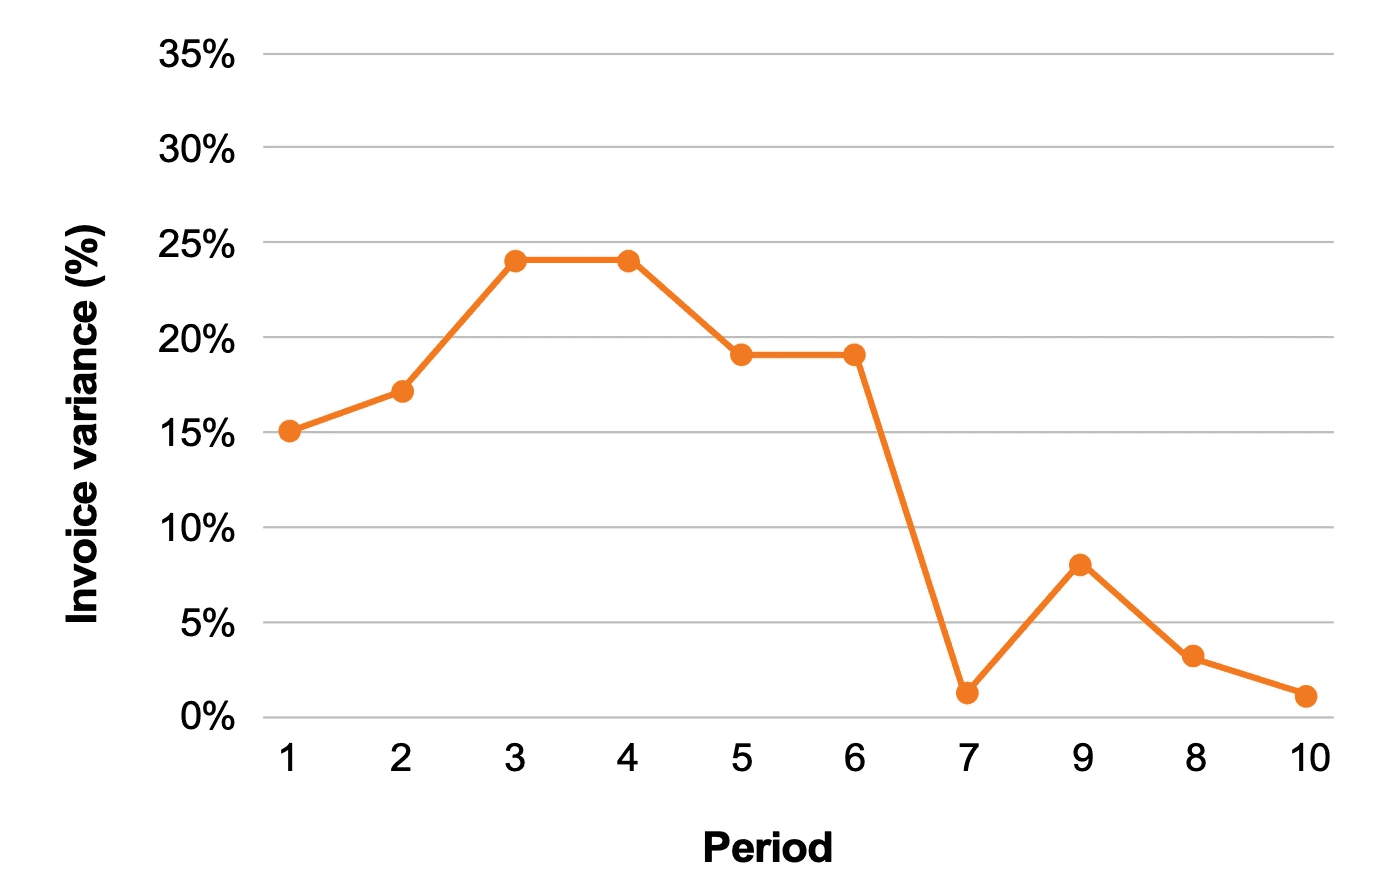
Identified and quantified hidden invoice variation across operations in Melbourne and Perth that peaked at 24%.
Reduced invoice variation from a peak of ~24% to ~1% through regular audits, education and compliance measures.
Improved driver compliance, strengthening accuracy and trust in execution data, and ultimately increasing confidence in driver job timings and invoice validation.
Radaro data is now embedded in their standardised cost analysis at Board level, fundamentally changing how transport spend is governed.
Variance between invoiced hours & execution data (%)
Variance between invoiced hours & execution data (%)
Testimonials


The introduction of Radaro intelligence and the new shift report BI page has delivered real, measurable value. The report has given us clear visibility across the operation, allowing us to quickly identify anomalies, understand exactly what work is being completed, how long tasks are taking, and critically, how this translates into the hours being invoiced.
Radaro Intelligence
The introduction of Radaro intelligence and the new shift report BI page has delivered real, measurable value. The report has given us clear visibility across the operation, allowing us to quickly identify anomalies, understand exactly what work is being completed, how long tasks are taking, and critically, how this translates into the hours being invoiced.
Radaro Intelligence
The Results with Radaro
24
%
Peak invoice variance identified
~
1
%
Invoice variance post-audit
200
k
Drops completed annually
Company Overview
A national facilities services provider operating across Australia, with 160+ drivers completing ~200,000 drops annually, where transport performance is critical to daily operations.
As an existing Radaro customer, the organisation had already digitised key parts of its delivery execution. However, the team began to suspect variances between 3rd party carrier invoiced hours and actual hours worked. To resolve this, the organisation introduced Radaro Intelligence as a bolt-on advanced analytics capability to turn that execution data into visibility and what they found was eye opening.
Industry
Facilities Services
Use Cases
Advanced analytics, fully custom metrics, and BI dashboards aligned to specific business goals.
01.
The Challenge
Limited transparency into shift execution and billable hours.
Margin pressure amplified the impact of small, recurring inefficiencies.
Unexplained “time gaps” between jobs, shifts, and depot activity impacting transport costs.
Inconsistent break deductions and cost centre allocation.
Variable driver compliance impacting operational data quality and accuracy.
Manual, high-effort, reactive processes delaying issue detection and resolution.
Case Study One
The image on the right is from the client’s previous Bi report, where there is no pickup, picked up, or in progress statuses visible. The screenshot is a real example sourced from their POD. In review, the client should have been shared 9.75 hours, leading to an identified variance of 4.25 hours.
Driver X on the 22nd of September, signed in as working at 05:41, and began being paid from 05:45.
Driver X completed 8 services over two trips for their customer. Driver X completed his last service at 17:59, which was a pickup only for one customer.
Driver then begun a break at 18:11, working a minute later, on break again at 19:44, and signed off as not working at 20:13, where they were paid until 20:15.
What this example shows is that Driver X clocked in to work 2 hours and 24 minutes before they begun loading the first customer in his vehicle, and signed out 2 hours and 14 minutes after completing his last delivery. The client was charged 14 hours for this shift.
In review, the client should have been shared 9.75 hours, leading to an identified variance of 4.25 hours.
02.
The Solution
Introduced the advanced level of Radaro Intelligence to create a clear, auditable view of shift activity and carrier-billed hours.
Implemented a Shift Report BI page, aligned directly with pick-up workflows in the Radaro app, to create a consistent operational view of job activity, timings, and time gaps.
The organisation introduced structured governance, audits, and accountability processes to ensure issues were identified and addressed early.
The organisation conducted targeted driver training to increase app compliance and data accuracy.
Case Study Two
The example on the right is from the new Bi report and contains each activity the driver completes. Driver X, on the 10th of November, signed in as working at 06:59, and began being paid from 07:00. Driver X completed 9 services over 3 trips, where they began their break at 15:00 and returned to working at 15:30.
After returning, they completed another trip, servicing 3 customers by 17:58. Driver X signed out of working at 18:10 and was paid until 18:15.
03.
The Outcome
Identified and quantified hidden invoice variation across operations in Melbourne and Perth that peaked at 24%.
Reduced invoice variation from a peak of ~24% to ~1% through regular audits, education and compliance measures.
Improved driver compliance, strengthening accuracy and trust in execution data, and ultimately increasing confidence in driver job timings and invoice validation.
Radaro data is now embedded in their standardised cost analysis at Board level, fundamentally changing how transport spend is governed.
Variance between invoiced hours & execution data (%)
Testimonials
The introduction of Radaro intelligence and the new shift report BI page has delivered real, measurable value. The report has given us clear visibility across the operation, allowing us to quickly identify anomalies, understand exactly what work is being completed, how long tasks are taking, and critically, how this translates into the hours being invoiced.
Radaro Intelligence
The introduction of Radaro intelligence and the new shift report BI page has delivered real, measurable value. The report has given us clear visibility across the operation, allowing us to quickly identify anomalies, understand exactly what work is being completed, how long tasks are taking, and critically, how this translates into the hours being invoiced.
Radaro Intelligence
Take Control of Your Last Mile
Discover what Radaro can do for you



"/><stop offset="1" stop-color="rgba(114, 163, 190, 0)"/></linearGradient></defs><g d="M 72 37.3 L 96.4 37.3 C 98.6 37.3 100.4 35.7 100.6 33.5 C 100.8 31.3 101.2 27.1 101.2 22.2 C 101.2 17.3 101 14.4 100.7 12.1 C 100.4 9.8 98.7 8.4 96.5 8.4 L 72 8.4 L 72 37.2 Z M 80 30.3 L 77.3 30.3 L 77.3 4.9 L 80 4.9 Z M 71 5.1 C 71.552 5.1 72 5.548 72 6.1 L 72 37.6 C 72 38.152 71.552 38.6 71 38.6 L 1 38.6 C 0.448 38.6 0 38.152 0 37.6 L 0 6.1 C 0 5.548 0.448 5.1 1 5.1 Z M 97.5 37.1 L 5.2 37.1 L 5.2 27.3 L 100.5 27.3 L 100.5 34.1 C 100.5 35.8 99.2 37.1 97.5 37.1 Z M 79.5 31.7 L 99.4 31.7 C 101.6 31.7 103.4 30.1 103.6 27.9 C 103.8 25.7 104.2 21.5 104.2 16.6 C 104.2 12.1 104 8.8 103.7 6.5 C 103.4 4.2 101.7 2.8 99.5 2.8 L 79.5 2.8 L 79.5 31.6 Z M 88.7 28.2 L 94.3 29.3 L 102 30.8 C 101.3 31.3 100.4 31.7 99.4 31.7 L 79.5 31.7 L 79.5 28.2 Z M 76.4 1.2 C 76.952 1.2 77.4 1.648 77.4 2.2 L 77.4 31.9 C 77.4 32.452 76.952 32.9 76.4 32.9 L 6.4 32.9 C 5.848 32.9 5.4 32.452 5.4 31.9 L 5.4 2.2 C 5.4 1.648 5.848 1.2 6.4 1.2 Z M 76.9 32.7 L 5.7 32.7 L 5.7 31.1 L 76.9 31.1 Z M 76.4 1.2 C 76.952 1.2 77.4 1.648 77.4 2.2 L 77.4 31.9 C 77.4 32.452 76.952 32.9 76.4 32.9 L 6.4 32.9 C 5.848 32.9 5.4 32.452 5.4 31.9 L 5.4 2.2 C 5.4 1.648 5.848 1.2 6.4 1.2 Z M 89.3 5.4 C 89 5.4 88.9 5.7 89 6 C 89.5 7.4 91 11.9 91 17.1 C 91 22.3 89.6 26.5 89 27.9 C 88.4 29.3 89 28.4 89.3 28.5 L 93.9 29.2 C 94.3 29.2 94.7 29 94.8 28.7 C 95.4 27.2 96.9 22.9 96.9 17 C 96.9 11.1 95.4 6.7 94.7 5.2 C 94 3.7 94.2 4.6 93.8 4.7 L 89.2 5.5 Z M 85.7 5.1 L 82.1 5.1 C 81.8 5.1 81.6 4.9 81.6 4.6 L 81.6 4.4 C 81.6 4.1 81.8 3.9 82.1 3.9 L 91.9 3.9 L 86.8 5 C 86.4 5 86.1 5.1 85.7 5.1 Z M 85.6 29.2 L 81.9 29.2 C 81.7 29.2 81.5 29.4 81.5 29.6 L 81.5 30 C 81.5 30.2 81.7 30.4 81.9 30.4 L 91.8 30.4 L 86.7 29.3 C 86.3 29.3 85.9 29.2 85.6 29.2 Z M 104.2 16.9 C 104.2 20 104.1 22.6 103.9 24.8 C 103.2 24.7 102.8 24.1 102.8 23.4 L 102.8 11.1 C 102.8 10.4 103.3 9.8 103.9 9.7 C 104 11.6 104.1 14 104.1 16.9 Z M 99.6 3.3 L 100.2 2.9 C 102 3.2 103.5 4.7 103.7 6.6 L 103.7 7 C 103.4 7.2 103.1 7.1 103 7 C 102.7 6.2 101.8 4.8 99.6 4.1 C 99.3 4.1 99.3 3.6 99.6 3.4 Z M 99.6 31.1 L 100.2 31.5 C 102 31.2 103.5 29.7 103.7 27.8 L 103.7 27.4 C 103.4 27.2 103.1 27.3 103 27.4 C 102.7 28.2 101.8 29.6 99.6 30.3 C 99.3 30.3 99.3 30.8 99.6 31 Z M 89.7 2.8 L 88.4 1 C 88.3 0.8 88.4 0.6 88.5 0.4 L 89.1 0 C 89.5 0 89.9 0.2 90.2 0.6 L 90.6 1.2 C 90.9 1.6 91 2.1 91 2.5 L 91 3.7 L 89.7 3.7 L 89.7 2.7 Z M 89.7 31.4 L 88.4 33.2 C 88.3 33.4 88.4 33.6 88.5 33.8 L 89.1 34.2 C 89.5 34.2 89.9 34 90.2 33.6 L 90.6 33 C 90.9 32.6 91 32.1 91 31.7 L 91 30.5 L 89.7 30.5 L 89.7 31.5 Z" fill="transparent" height="38.599999904632575px" id="LuoQ0xnNj" width="104.20000000000002px"><g d="M 72 37.3 L 96.4 37.3 C 98.6 37.3 100.4 35.7 100.6 33.5 C 100.8 31.3 101.2 27.1 101.2 22.2 C 101.2 17.3 101 14.4 100.7 12.1 C 100.4 9.8 98.7 8.4 96.5 8.4 L 72 8.4 L 72 37.2 Z M 80 30.3 L 77.3 30.3 L 77.3 4.9 L 80 4.9 Z M 71 5.1 C 71.552 5.1 72 5.548 72 6.1 L 72 37.6 C 72 38.152 71.552 38.6 71 38.6 L 1 38.6 C 0.448 38.6 0 38.152 0 37.6 L 0 6.1 C 0 5.548 0.448 5.1 1 5.1 Z M 97.5 37.1 L 5.2 37.1 L 5.2 27.3 L 100.5 27.3 L 100.5 34.1 C 100.5 35.8 99.2 37.1 97.5 37.1 Z M 79.5 31.7 L 99.4 31.7 C 101.6 31.7 103.4 30.1 103.6 27.9 C 103.8 25.7 104.2 21.5 104.2 16.6 C 104.2 12.1 104 8.8 103.7 6.5 C 103.4 4.2 101.7 2.8 99.5 2.8 L 79.5 2.8 L 79.5 31.6 Z M 88.7 28.2 L 94.3 29.3 L 102 30.8 C 101.3 31.3 100.4 31.7 99.4 31.7 L 79.5 31.7 L 79.5 28.2 Z M 76.4 1.2 C 76.952 1.2 77.4 1.648 77.4 2.2 L 77.4 31.9 C 77.4 32.452 76.952 32.9 76.4 32.9 L 6.4 32.9 C 5.848 32.9 5.4 32.452 5.4 31.9 L 5.4 2.2 C 5.4 1.648 5.848 1.2 6.4 1.2 Z M 76.9 32.7 L 5.7 32.7 L 5.7 31.1 L 76.9 31.1 Z M 76.4 1.2 C 76.952 1.2 77.4 1.648 77.4 2.2 L 77.4 31.9 C 77.4 32.452 76.952 32.9 76.4 32.9 L 6.4 32.9 C 5.848 32.9 5.4 32.452 5.4 31.9 L 5.4 2.2 C 5.4 1.648 5.848 1.2 6.4 1.2 Z M 89.3 5.4 C 89 5.4 88.9 5.7 89 6 C 89.5 7.4 91 11.9 91 17.1 C 91 22.3 89.6 26.5 89 27.9 C 88.4 29.3 89 28.4 89.3 28.5 L 93.9 29.2 C 94.3 29.2 94.7 29 94.8 28.7 C 95.4 27.2 96.9 22.9 96.9 17 C 96.9 11.1 95.4 6.7 94.7 5.2 C 94 3.7 94.2 4.6 93.8 4.7 L 89.2 5.5 Z M 85.7 5.1 L 82.1 5.1 C 81.8 5.1 81.6 4.9 81.6 4.6 L 81.6 4.4 C 81.6 4.1 81.8 3.9 82.1 3.9 L 91.9 3.9 L 86.8 5 C 86.4 5 86.1 5.1 85.7 5.1 Z M 85.6 29.2 L 81.9 29.2 C 81.7 29.2 81.5 29.4 81.5 29.6 L 81.5 30 C 81.5 30.2 81.7 30.4 81.9 30.4 L 91.8 30.4 L 86.7 29.3 C 86.3 29.3 85.9 29.2 85.6 29.2 Z M 104.2 16.9 C 104.2 20 104.1 22.6 103.9 24.8 C 103.2 24.7 102.8 24.1 102.8 23.4 L 102.8 11.1 C 102.8 10.4 103.3 9.8 103.9 9.7 C 104 11.6 104.1 14 104.1 16.9 Z M 99.6 3.3 L 100.2 2.9 C 102 3.2 103.5 4.7 103.7 6.6 L 103.7 7 C 103.4 7.2 103.1 7.1 103 7 C 102.7 6.2 101.8 4.8 99.6 4.1 C 99.3 4.1 99.3 3.6 99.6 3.4 Z M 99.6 31.1 L 100.2 31.5 C 102 31.2 103.5 29.7 103.7 27.8 L 103.7 27.4 C 103.4 27.2 103.1 27.3 103 27.4 C 102.7 28.2 101.8 29.6 99.6 30.3 C 99.3 30.3 99.3 30.8 99.6 31 Z M 89.7 2.8 L 88.4 1 C 88.3 0.8 88.4 0.6 88.5 0.4 L 89.1 0 C 89.5 0 89.9 0.2 90.2 0.6 L 90.6 1.2 C 90.9 1.6 91 2.1 91 2.5 L 91 3.7 L 89.7 3.7 L 89.7 2.7 Z M 89.7 31.4 L 88.4 33.2 C 88.3 33.4 88.4 33.6 88.5 33.8 L 89.1 34.2 C 89.5 34.2 89.9 34 90.2 33.6 L 90.6 33 C 90.9 32.6 91 32.1 91 31.7 L 91 30.5 L 89.7 30.5 L 89.7 31.5 Z" fill="transparent" height="38.599999904632575px" id="zezgG8Y1q" width="104.20000000000002px"><g opacity="0.4"><path d="M 0 28.9 L 24.4 28.9 C 26.6 28.9 28.4 27.3 28.6 25.1 C 28.8 22.9 29.2 18.7 29.2 13.8 C 29.2 8.9 29 6 28.7 3.7 C 28.4 1.4 26.7 0 24.5 0 L 0 0 L 0 28.8 Z" fill="rgb(215, 227, 232)" height="28.900000000000006px" id="m6px2y2al" transform="translate(72 8.4)" width="29.19999999999999px"/></g><path d="M 2.7 25.4 L 0 25.4 L 0 0 L 2.7 0 Z" fill="rgb(7, 64, 89)" height="25.4px" id="cyMhIGwIO" transform="translate(77.3 4.9)" width="2.700000000000017px"/><g opacity="0.4"><path d="M 71 0 C 71.552 0 72 0.448 72 1 L 72 32.5 C 72 33.052 71.552 33.5 71 33.5 L 1 33.5 C 0.448 33.5 0 33.052 0 32.5 L 0 1 C 0 0.448 0.448 0 1 0 Z" fill="rgb(215, 227, 232)" height="33.50000000000001px" id="V9wSu3WkR" transform="translate(0 5.1)" width="72px"/></g><g opacity="0.8"><path d="M 92.3 9.8 L 0 9.8 L 0 0 L 95.3 0 L 95.3 6.8 C 95.3 8.5 94 9.8 92.3 9.8 Z" fill="url(%23NPpo5c7u7-389490388-linear-gradient)" height="9.800000000000011px" id="NPpo5c7u7" transform="translate(5.2 27.3)" width="95.29999999999998px"/></g><path d="M 0 28.9 L 19.9 28.9 C 22.1 28.9 23.9 27.3 24.1 25.1 C 24.3 22.9 24.7 18.7 24.7 13.8 C 24.7 9.3 24.5 6 24.2 3.7 C 23.9 1.4 22.2 0 20 0 L 0 0 L 0 28.8 Z" fill="rgb(215, 227, 232)" height="28.9px" id="QiYhvoPI2" transform="translate(79.5 2.8)" width="24.700000000000017px"/><g opacity="0.4"><path d="M 9.2 0 L 14.8 1.1 L 22.5 2.6 C 21.8 3.1 20.9 3.5 19.9 3.5 L 0 3.5 L 0 0 Z" fill="rgb(114, 163, 190)" height="3.5px" id="iw09x_5cV" transform="translate(79.5 28.2)" width="22.5px"/></g><path d="M 71 0 C 71.552 0 72 0.448 72 1 L 72 30.7 C 72 31.252 71.552 31.7 71 31.7 L 1 31.7 C 0.448 31.7 0 31.252 0 30.7 L 0 1 C 0 0.448 0.448 0 1 0 Z" fill="rgb(249, 250, 252)" height="31.70000000000001px" id="enHG0Xv5x" transform="translate(5.4 1.2)" width="71.99999999999999px"/><g opacity="0.4"><path d="M 71.2 1.6 L 0 1.6 L 0 0 L 71.2 0 Z" fill="rgb(114, 163, 190)" height="1.6000000000000156px" id="nNlyDyI8O" transform="translate(5.7 31.1)" width="71.20000000000002px"/></g><path d="M 71 0 C 71.552 0 72 0.448 72 1 L 72 30.7 C 72 31.252 71.552 31.7 71 31.7 L 1 31.7 C 0.448 31.7 0 31.252 0 30.7 L 0 1 C 0 0.448 0.448 0 1 0 Z" fill="transparent" height="31.70000000000001px" id="fXaCrMspo" stroke-dasharray="" stroke-linecap="butt" stroke-linejoin="miter" stroke-miterlimit="10" stroke-width="1" stroke="rgb(215, 227, 232)" transform="translate(5.4 1.2)" width="71.99999999999999px"/><path d="M 7.8 1.5 C 7.5 1.5 7.4 1.8 7.5 2.1 C 8 3.5 9.5 8 9.5 13.2 C 9.5 18.4 8.1 22.6 7.5 24 C 6.9 25.4 7.5 24.5 7.8 24.6 L 12.4 25.3 C 12.8 25.3 13.2 25.1 13.3 24.8 C 13.9 23.3 15.4 19 15.4 13.1 C 15.4 7.2 13.9 2.8 13.2 1.3 C 12.5 -0.2 12.7 0.7 12.3 0.8 L 7.7 1.6 Z M 4.2 1.2 L 0.6 1.2 C 0.3 1.2 0.1 1 0.1 0.7 L 0.1 0.5 C 0.1 0.2 0.3 0 0.6 0 L 10.4 0 L 5.3 1.1 C 4.9 1.1 4.6 1.2 4.2 1.2 Z M 4.1 25.3 L 0.4 25.3 C 0.2 25.3 0 25.5 0 25.7 L 0 26.1 C 0 26.3 0.2 26.5 0.4 26.5 L 10.3 26.5 L 5.2 25.4 C 4.8 25.4 4.4 25.3 4.1 25.3 Z M 22.7 13 C 22.7 16.1 22.6 18.7 22.4 20.9 C 21.7 20.8 21.3 20.2 21.3 19.5 L 21.3 7.2 C 21.3 6.5 21.8 5.9 22.4 5.8 C 22.5 7.7 22.6 10.1 22.6 13 Z" fill="rgb(7, 64, 89)" height="26.499999237060543px" id="zg2puoduN" transform="translate(81.5 3.9)" width="22.699999237060524px"/><path d="M 0.225 0.4 L 0.825 0 C 2.625 0.3 4.125 1.8 4.325 3.7 L 4.325 4.1 C 4.025 4.3 3.725 4.2 3.625 4.1 C 3.325 3.3 2.425 1.9 0.225 1.2 C -0.075 1.2 -0.075 0.7 0.225 0.5 Z M 0.225 28.2 L 0.825 28.6 C 2.625 28.3 4.125 26.8 4.325 24.9 L 4.325 24.5 C 4.025 24.3 3.725 24.4 3.625 24.5 C 3.325 25.3 2.425 26.7 0.225 27.4 C -0.075 27.4 -0.075 27.9 0.225 28.1 Z" fill="rgb(255, 184, 41)" height="28.599999167607464px" id="yJQ3TgwJ6" transform="translate(99.375 2.9)" width="4.325000000000017px"/><path d="M 1.341 2.8 L 0.041 1 C -0.059 0.8 0.041 0.6 0.141 0.4 L 0.741 0 C 1.141 0 1.541 0.2 1.841 0.6 L 2.241 1.2 C 2.541 1.6 2.641 2.1 2.641 2.5 L 2.641 3.7 L 1.341 3.7 L 1.341 2.7 Z M 1.341 31.4 L 0.041 33.2 C -0.059 33.4 0.041 33.6 0.141 33.8 L 0.741 34.2 C 1.141 34.2 1.541 34 1.841 33.6 L 2.241 33 C 2.541 32.6 2.641 32.1 2.641 31.7 L 2.641 30.5 L 1.341 30.5 L 1.341 31.5 Z" fill="rgb(7, 64, 89)" height="34.2px" id="QzqBzedlz" transform="translate(88.359 0)" width="2.6414213562373448px"/></g></g></svg>)

Radaro is the intelligent delivery management platform built for complex, real-world supply chains.
Deliver Better At Every Mile.
Company
Radaro © 2026. All rights reserved.
Take Control of Your Last Mile
Discover what Radaro can do for you
Radaro is the intelligent delivery management platform built for complex, real-world supply chains.
Deliver Better At Every Mile.
Company
Radaro © 2026. All rights reserved.
Take Control of Your Last Mile
Discover what Radaro can do for you
Radaro is the intelligent delivery management platform built for complex, real-world supply chains.
Deliver Better At Every Mile.
Radaro © 2026. All rights reserved.
Take Control of Your Last Mile
Discover what Radaro can do for you
Radaro is the intelligent delivery management platform built for complex, real-world supply chains.
Deliver Better At Every Mile.
Company
Radaro © 2026. All rights reserved.
